
South Sydney and Eastern Suburbs, now the Sydney Roosters, are foundation clubs of the 1908 New South Wales premiership, and they have been playing each other ever since. They have met 258 times in completed first-class matches. This page sets out the all-time head-to-head record, the record in premiership matches, the record in each competition and in finals, and shows how the balance of power has shifted decade by decade.
Figures are complete to the most recent meeting: South Sydney 50–20 Sydney Roosters at Allianz Stadium on 4 September 2026.
All-time record: first-class matches
South Sydney lead the all-time series by 12 wins: 132 to 120, with 6 draws. Yet the Roosters have scored more points, 4,119 to South Sydney’s 4,069, thanks largely to a run of heavy wins from the mid-1990s. South Sydney’s lead peaked at 30 wins: they first reached it in March 1990 and last held it in June 1994. The Roosters have clawed back 18 since. The series was last level in April 1948, and the Roosters last led it in August 1921.
NRL record (1998–)
Since the NRL began in 1998, the clubs have met 56 times: 52 in the regular season and 4 in finals. The Roosters lead 35 to 21, with no draws, and on points 1,299 to 1,129. Most of that lead was built early. The Roosters won the first nine NRL meetings and 14 of the 16 up to 2008. Since 2009 the derby has been close: Roosters 21 wins, South Sydney 19, with South Sydney ahead on points, 908 to 841. In the regular season the Roosters lead 33 to 19; in finals it is 2–2. The biggest NRL wins are South Sydney’s 60–8 in 2020 and the Roosters’ 48–6 in 2024.
Premiership record (1908–)
Premiership matches, regular rounds and finals together, from the NSWRFL in 1908 through the NSWRL, ARL and NRL, make up 237 of the 258 meetings. South Sydney lead 122 to 110, with 5 draws. After 118 years, the points are separated by one: South Sydney 3,827, Roosters 3,826. Up to 1994, South Sydney won 101 of 177 premiership meetings and lost 71. Since 1995 the Roosters have won 39 of 60, including all four in the ARL era.
Record by competition
| Competition | Played | South Sydney wins | Drawn | Roosters wins | South Sydney points | Roosters points |
|---|---|---|---|---|---|---|
| NSWRFL / NSWRL premiership, regular season (1908–1994) | 168 | 96 | 5 | 67 | 2,540 | 2,248 |
| ARL premiership, regular season (1995–1997) | 4 | 0 | 0 | 4 | 28 | 170 |
| NRL premiership, regular season (1998–) | 52 | 19 | 0 | 33 | 1,057 | 1,221 |
| Finals (1908–) | 13 | 7 | 0 | 6 | 202 | 187 |
| City Cup (1912–1937) | 7 | 2 | 1 | 4 | 90 | 94 |
| Pre-season cup (1963–1981) | 13 | 8 | 0 | 5 | 144 | 186 |
| AMCO Cup, midweek (1975) | 1 | 0 | 0 | 1 | 8 | 13 |
| Total | 258 | 132 | 6 | 120 | 4,069 | 4,119 |
Finals
The clubs have met 13 times in finals, and South Sydney lead 7 to 6. Five of those meetings decided the premiership, all between 1908 and 1935: South Sydney won in 1908, 1928 and 1931, Eastern Suburbs in 1923 and 1935. The 1908 final, a 14–12 South Sydney win, settled the first premiership. The clubs have never met in a modern grand final, but they have met four times in the NRL finals since 2014, two wins each.
| Date | Round | Result | Venue |
|---|---|---|---|
| 29 Aug 1908 | Final | South Sydney 14–12 Eastern Suburbs | RAS Showground |
| 12 Sep 1923 | Final | Eastern Suburbs 15–12 South Sydney | SCG |
| 11 Sep 1926 | Semi-final | South Sydney 21–5 Eastern Suburbs | SCG |
| 15 Sep 1928 | Final | South Sydney 26–5 Eastern Suburbs | RAS Showground |
| 12 Sep 1931 | Grand final (challenge) | South Sydney 12–7 Eastern Suburbs | Sydney Sports Ground |
| 3 Sep 1932 | Semi-final | South Sydney 26–8 Eastern Suburbs | Sydney Sports Ground |
| 25 Aug 1934 | Semi-final | Eastern Suburbs 19–6 South Sydney | Sydney Sports Ground |
| 14 Sep 1935 | Final | Eastern Suburbs 19–3 South Sydney | SCG |
| 27 Aug 1938 | Semi-final | Eastern Suburbs 19–10 South Sydney | SCG |
| 26 Sep 2014 | Preliminary final | South Sydney 32–22 Sydney Roosters | ANZ Stadium |
| 22 Sep 2018 | Preliminary final | Sydney Roosters 12–4 South Sydney | Allianz Stadium |
| 13 Sep 2019 | Qualifying final | Sydney Roosters 30–6 South Sydney | SCG |
| 11 Sep 2022 | Elimination final | South Sydney 30–14 Sydney Roosters | Allianz Stadium |
The Ron Coote Cup (2007–)
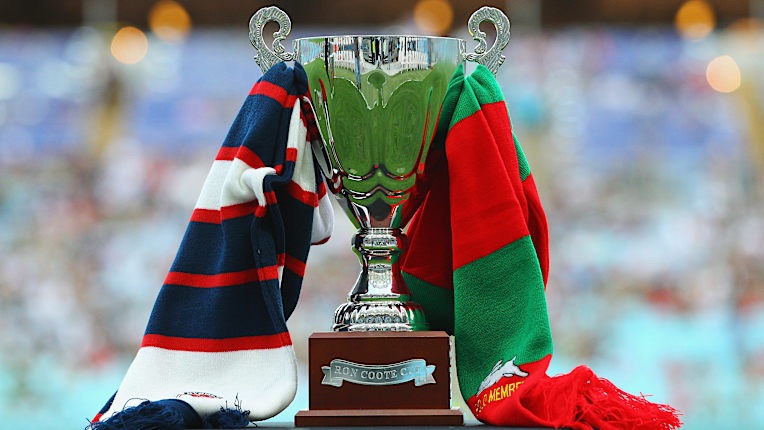
Since 2007 the clubs have played for the Ron Coote Cup. It is named after Ron Coote, who played for, captained and won premierships with both clubs between 1964 and 1978: four with South Sydney and two with Eastern Suburbs. He was the first player to reach 100 first-grade games for two clubs, and in 2024 he was named rugby league’s 14th Immortal. The cup goes to the club with the higher aggregate score across the two regular-season meetings each year; finals do not count. No contest has yet finished level on aggregate, and neither club has published a tiebreak.
After 20 contests the cup is level at 10 each, and South Sydney are the holders after taking the 2026 contest 68–46. The Roosters have won more of the 40 cup games, 22 to 18, but South Sydney have scored more points, 906 to 851. They have also come out on top more often when each side won a leg: South Sydney took 7 of the 12 split years, the Roosters 5. One side has won both legs eight times: South Sydney in 2009, 2019 and 2021, and the Roosters in 2008, 2010, 2017, 2023 and 2024. South Sydney’s five in a row, from 2018 to 2022, is the longest run. The biggest margins are South Sydney’s 60 points in 2009 and 52 in 2021, and the Roosters’ 50 in 2024. Three contests were decided by two points: 2007, 2012 and 2022.
| Season | First leg | Second leg | Aggregate (South Sydney–Roosters) | Cup winner |
|---|---|---|---|---|
| 2007 | South Sydney 18–6 | Roosters 26–12 | 30–32 | Roosters (by 2) |
| 2008 | Roosters 34–20 | Roosters 22–20 | 40–56 | Roosters (by 16) |
| 2009 | South Sydney 52–12 | South Sydney 40–20 | 92–32 | South Sydney (by 60) |
| 2010 | Roosters 36–10 | Roosters 18–14 | 24–54 | Roosters (by 30) |
| 2011 | Roosters 40–29 | South Sydney 21–20 | 50–60 | Roosters (by 10) |
| 2012 | Roosters 24–20 | South Sydney 24–22 | 44–46 | Roosters (by 2) |
| 2013 | South Sydney 28–10 | Roosters 24–12 | 40–34 | South Sydney (by 6) |
| 2014 | South Sydney 28–8 | Roosters 22–18 | 46–30 | South Sydney (by 16) |
| 2015 | South Sydney 34–26 | Roosters 30–0 | 34–56 | Roosters (by 22) |
| 2016 | South Sydney 42–10 | Roosters 17–10 | 52–27 | South Sydney (by 25) |
| 2017 | Roosters 20–6 | Roosters 14–12 | 18–34 | Roosters (by 16) |
| 2018 | South Sydney 26–14 | Roosters 18–14 | 40–32 | South Sydney (by 8) |
| 2019 | South Sydney 26–16 | South Sydney 16–10 | 42–26 | South Sydney (by 16) |
| 2020 | Roosters 28–12 | South Sydney 60–8 | 72–36 | South Sydney (by 36) |
| 2021 | South Sydney 26–16 | South Sydney 54–12 | 80–28 | South Sydney (by 52) |
| 2022 | South Sydney 28–16 | Roosters 26–16 | 44–42 | South Sydney (by 2) |
| 2023 | Roosters 20–18 | Roosters 26–12 | 30–46 | Roosters (by 16) |
| 2024 | Roosters 48–6 | Roosters 36–28 | 34–84 | Roosters (by 50) |
| 2025 | South Sydney 20–14 | Roosters 36–6 | 26–50 | Roosters (by 24) |
| 2026 | Roosters 26–18 | South Sydney 50–20 | 68–46 | South Sydney (by 22) |
Wins by decade
The early decades swung back and forth: Eastern Suburbs had the edge in the 1910s, 1930s and 1940s, South Sydney in the 1920s. South Sydney then won the derby in every decade from the 1950s to the 1980s, losing only 33 of 94 meetings. The 1990s and 2000s belonged to the Roosters, who won 22 of 31; South Sydney were out of the competition in 2000 and 2001. Since 2010 the two have been close: Roosters 21 wins, South Sydney 17.
| Decade | Played | South Sydney wins | Drawn | Roosters wins |
|---|---|---|---|---|
| 1900s | 4 | 3 | 0 | 1 |
| 1910s | 24 | 11 | 0 | 13 |
| 1920s | 22 | 14 | 2 | 6 |
| 1930s | 25 | 11 | 1 | 13 |
| 1940s | 20 | 8 | 1 | 11 |
| 1950s | 20 | 14 | 0 | 6 |
| 1960s | 25 | 15 | 1 | 9 |
| 1970s | 27 | 15 | 0 | 12 |
| 1980s | 22 | 15 | 1 | 6 |
| 1990s | 15 | 5 | 0 | 10 |
| 2000s | 16 | 4 | 0 | 12 |
| 2010s | 23 | 10 | 0 | 13 |
| 2020s | 15 | 7 | 0 | 8 |
Streaks, margins and crowds
The longest winning run belongs to the Roosters: 13 straight wins from April 1995 to March 2005, ended by a 17–16 South Sydney win in August 2005. South Sydney’s best is 10, which they managed twice: from July 1963 to March 1967 and from August 1968 to April 1972. Over the last 10 meetings the Roosters lead 7 to 3, though South Sydney won the most recent, 50–20 in September 2026.
The biggest wins are the Roosters’ 62–0 on Anzac Day 1996 and South Sydney’s 60–8 in September 2020. South Sydney also won 50–0 at the Sydney Sports Ground in 1952. The highest-scoring meeting was the Roosters’ 56–16 win in August 1992 (72 points). The biggest recorded crowd is 59,708, for a round-26 match on 6 September 2013, won 24–12 by the Roosters.
South Sydney have the better record when listed as the home side, with 79 wins, 5 draws and 51 defeats. The Roosters, at home, have 69 wins, 1 draw and 53 defeats. Redfern Oval was a fortress: South Sydney won 32 of the 44 meetings played there.
About these figures
Results, dates and venues are compiled from published match records, for first-class matches, premiership matches, finals and each cup. Only first-class matches are counted. That leaves out two pre-season meetings: the 1963 AMPOL Cup (South Sydney 18–15) and the 2024 NRL Pre-Season Challenge (Roosters 46–10). With them, the record would be 133–6–121 from 260. The first meeting was on 16 May 1908, a 13–12 Eastern Suburbs win at the RAS Showground. Where a source omits a month from a date, it has been taken from the match before. The Roosters played as Eastern Suburbs until 1994 and as Sydney City from 1995 to 1999. Clubs are listed alphabetically throughout.

